Establishing the key length from Vigenère cipher text
Previously, we looked at the Vigenère cipher and I gave some code to produce it. I also looked at some of the statistical properties.
This was the text being analysed:
LRPBB HKQBG WIYSA DEURQ LVFOT YEZKV
ELAIG DXADC TRSHB PBBZN TRTWF NSZRH
NXFCC ZVFVB DEXZS ZVABR ZRQTB CEXZG
SEFWF ZYDAB EXAWF TXZCG LRPMR EWMWQ
ASDHU ZWTCY OSGHL ZYDVN YHMBQ DAQOE
NVUSQ LXTCF LRPOE LQUGN ESZQR ZZQFP
ZQQPL PBMAC WISFH XFXWA RXAVV XWQZS
YIHSE ELQZR DWBCE ELAGF EVQHP SIPCH
ELUGU LRPOA OXTSS ZYDTE TIZRF CIBSN
EIPKV ELABR GSUQR ELQTB CQGZN OMOHN
EIPPL OEDHN RRMBN WPRCE ZRQCA PJAFN
WPFVN EWISY WRAKY PXGGR GIDMB YIDSG
TVQHB SMECJ YLAAR DEURQ LVFOT YEZOF
TJTSU LHPCA PRAHU TRSPH EGAAZ LRPOY
WLUGY TJQOA OEFHR YXUCA QSDTE ZQFVV
DQAAR YXISN CIMHS PYPKV ELFVR NEDRV
YEX
If we had some random string of letters, each letter would appear roughly one time in 26; but in any real language, such as English, this will not be the case.
Some letters will be more common than others.
Now, for a Caesar shift or monoalphabetic cipher, this will also be true, some letters will be more common even after encryption, but in a polyalphabetic cipher this pattern will wash out.
With Vigenère, the shifting is periodic. If the key is N letters long, then every Nth letter is shifted the same amount. We effectively have a bunch of Caesar shifts.
So, how do we use this to get the key length?
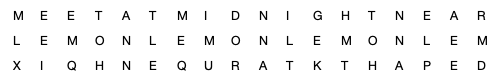
We can line the text up with a offset copy of itself, and look for matches.
Offsetting the message against itself
Most of the time, we will be offsetting a random amount, and the common letters we see in one set of Caesar shifts do not line up with another.
However, if we offset by a multiple of the key length, we are lining up pairs of letters that are Caesar shifted the same way. We will therefore see more matches as the underlying text is not random.
We can plot the number of matches against the offset and look for peaks. More than this, if we see a peak when we shift by one keylength, we should see a peak for two such shifts, and three.
When I do this for the ciphertext I am trying to analyse, I get the graph below. Obviously this is a technique that works better with more data.
It looks like the key is 5 letters long
We now know the key is 5 letters long, we see peaks for an offset of 5 characters, of 10, of 15, of 25 and so on. Not every peak is relevant, for example, the key length is not 4, as there are not significant peaks at 8, 12, 16, and some multiples of 5 are not as significant, e.g. 20.
Now we have the key length, we can try to decrypt the text. That’ll be a new post.
The code I used for this post is shown below
Links
Title image (public domain)
More Cryptography posts
More Vigenère posts


Python 3 Code for finding key length
# I'm going to plot a nice graph
import matplotlib.pyplot as plt
import numpy as np

# grab the ciphertext
filetimetable = open("vigciphertext.txt","r")
lines=filetimetable.readlines()
filetimetable.close()

# let's make it all one string
working=""
for line in lines:
    for char in line:
        asc=ord(char)
        if (64 < asc < 91) or ( 96 < asc < 123):
            char=char.upper()
            working+=char

# shift  the ciphertext against itself.
# count up number of matches between
# ciphertext and shifted ciphertext
offsets=[]
data=[]

# this is for lebelling the peaks
threshold=0

# let's only do a small number of shifts, more text, longer keys tested.
# you might want to fiddle with the top value in the range
for offset in range(1,int(len(working)/10)):
    matches=0
    for j in range(len(working)-offset):
        if working[j]==working[j+offset]:
            matches+=1
    threshold+=matches
    data.append(matches)
    offsets.append(offset)

# this sets a threshold above which a point is labelled
threshold=int(1.2*threshold/offset)

# lets prep the data for plotting
x=np.array(offsets)
y=np.array(data)
plt.plot(x,y)

# let's label any high points
for i in range(len(offsets)):
    if data[i]>threshold:
        plt.text(offsets[i],data[i],str(i+1))

# How frequent are x-axis gridlines?
stepsize=int(offset/10)
plt.xticks(np.arange(0, offset, step=stepsize))
# label axes and title
plt.xlabel('Offsets')
plt.ylabel('Matches')
plt.title('Look for peaks that are multiples of some key length')
plt.grid(b=True, which='major', color='#666666', linestyle='-')
# show the graph
plt.show()